Gyana has been shut down. Read more on our blog.
* yes, we really mean any!
Stop wrestling with manual exports, #N/A nightmares and stale data. Start delivering insights that move your business forward.
Turn your
Google Analytics  data into this
“my life-saving tool”
“a real no-code data platform”
“I LOVE! LOVE!! LOVE!! it!”
“thanks for this powerful app”
“well thought out from the bottom up”
“the best tool for analyzing data without code”
“My dream No Code Analytics”
“you've got an amazing product”


Trusted by 2,000+ customers, from small businesses to global enterprises.
You can build a completely custom report for your business, without jumping between tools or hiring expensive engineers. All in three simple steps.
Connect to most popular online sources out of the box, including apps, databases, webhooks and APIs. Need something custom? We can integrate any new source in 2 weeks.
100+ native integrations • 2B+ rows synced
No more downloading CSVs every week
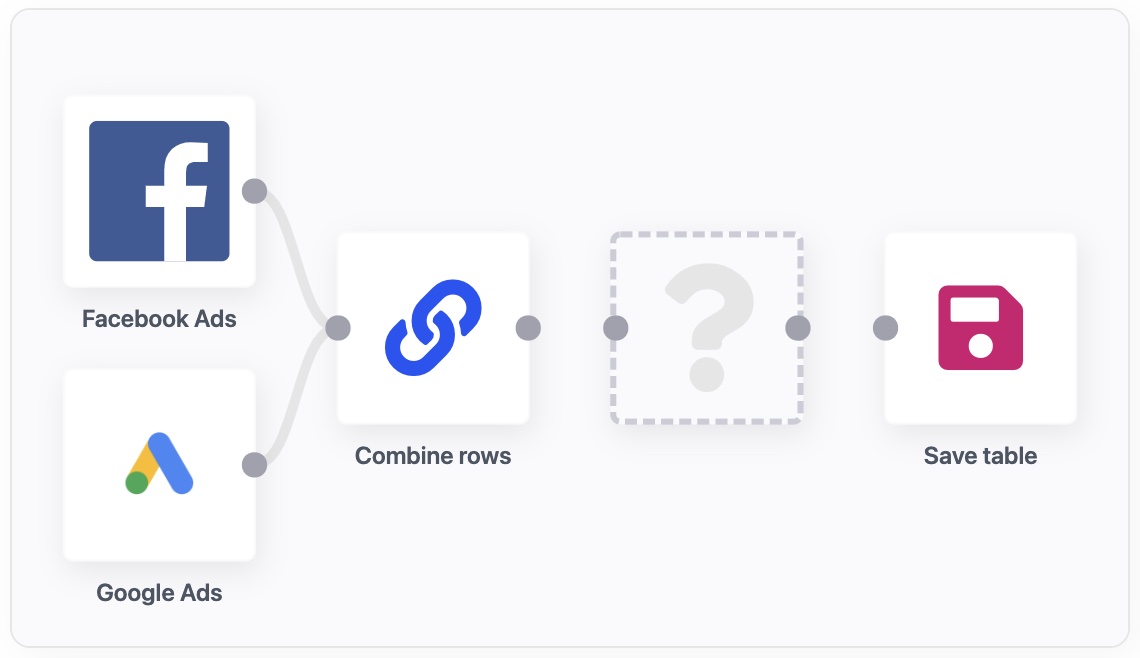
Our visual editor makes it easy. Connect data processing steps like Filter Join Formula and watch as automation does all the heavy lifting for you. Your workflows can be as simple or as complex as you design them.
19 nodes • 74 functions • Unlimited flexibility
Say goodbye to #N/A, #REF and friends
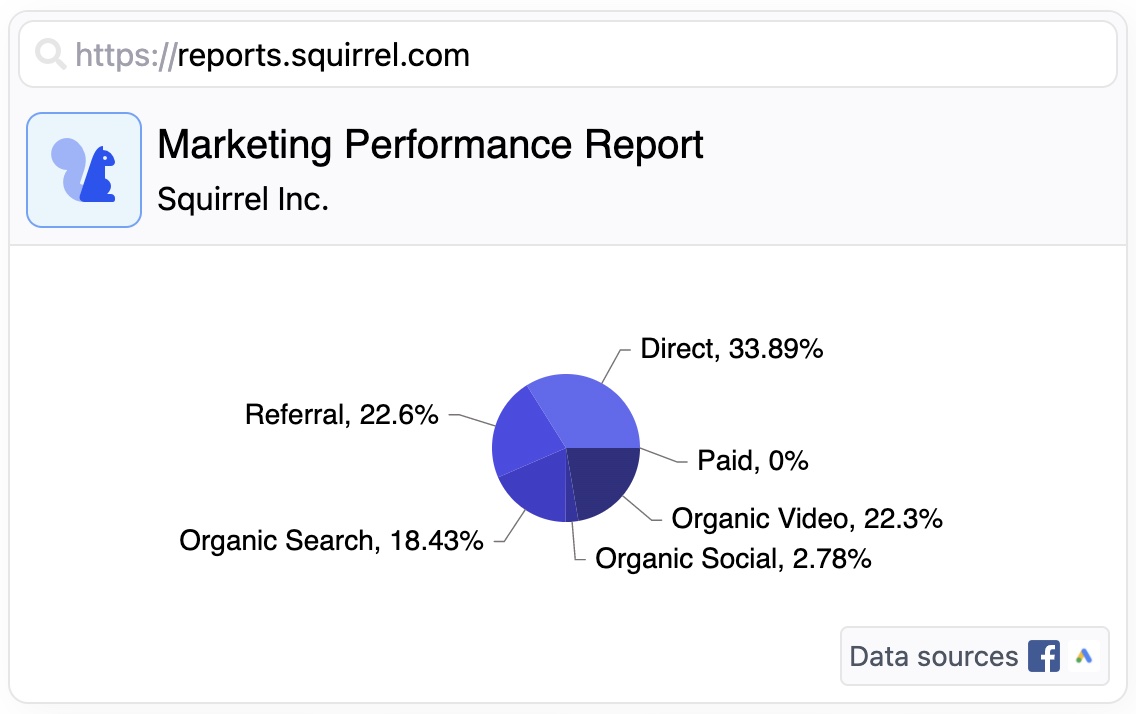
It's like making a presentation, but with live data sources that never break. Drag and drop widgets like Pie Funnel Embed , customize your theme and share branded links.
27 widgets • Freeform canvas • Zero constraints
Give your browser tabs a holiday
Gyana automates the boring parts of building and maintaining reports. You'll have more time to learn from stakeholders, and discover those key insights that make you rethink everything.
10x Faster to build and iterate How do I change this data source?
Zero Time spent in maintenance Why is this chart broken (again)?
100% Explicit flow of data from source to chart (1 year later) How did we build that?
Gyana was designed to help you manage reporting for multiple clients. You'll be able to automate the generic stuff, but with tailored insights where it matters.
No more details dropped or missed deadlines
Manage each client in separate, secure workspaces. Team collaboration with granular permissions for your analysts.
Design a reporting experience that feels like an extension of your website. Themes, whitelabeling, embeds and custom domains.
You can copy & paste the entire report, and change the data sources. No matter how complex, it will all just work.
It's like mission control for report health. Spot issues early, identify the root cause and fix it fast. No more silently broken charts.
“Gyana as a data manipulation tool is super powerful. We are currently using industry leading tools like Supermetrics and Google Data Studio, but are always faced with fixing breaks whenever we make changes to our reporting workflow. Gyana gives us the flexibility to add new connectors, new channels and pull reports all in one place.”
We'll support you on every step of your journey to Gyana mastery.
Try Gyana
Join thousands of Gyana users worldwide, discover a better way to build custom reports.